
How to measure your SEO success?
Digital penetration has already crossed 50% and with giant techs like Google, Facebook trying to penetrate Internet to far reaches of the world, this means business is going to be entirely digital within few years down the line.
That means a significant number of customers would be looking for your product on the search engines where you have to appear to be able to sell. Currently, the competition to be seen visible is very hard in the search engine and coming to the top position of the result is even harder.
To increase your business visibility, marketing and branding in the digital world, there is SEO, Social Media, PPC, Content marketing to give you the essential boost you need. A recent study conducted by SEJ states that “SEO-related spending will be worth $80 billion by 2020”
Reaching to the top position in a search engine for your targeted keywords is a gradual process, and it takes months time to plan and execute. SEO is a time-consuming process and one of the hardest marketing channel to measure. The cost of SEO for your website depends on a lot of factor including market competition, keywords, website structure, links, etc. But how do you know, if the monthly dollars you are spending on SEO is giving you the desired ROI? Is your SEO strategy giving you any success? How do you plan to measure it?
Compared to other marketing channels, SEO doesn’t give instant results. Either you are on the first page or nothing. Even if you will rank on the 2nd page you will not get much traffic because 89% of the users don’t go beyond the first page.
But is SEO just about rankings and traffic? What are the other ways to measure your SEO success? Well…! A lot of webmaster measures SEO success in a wrong way. Submitting 200+ spam directories in a month, blog commenting, targeting very specific keywords for a page, creating a lot of duplicate pages, etc. are some of the strategies which Google advice not to use. If you are measuring any of these tactics and taking it for improvement then you should stop right now and measure these metrics instead.
In today’s article, we will discuss what significant factors are important to measure your SEO success.
1. Increase in Organic Leads –
The main goal of a business is to get marketing qualified leads for their business. These leads then convert into customers if they get the information they are looking for on the website.
When it comes to SEO, one of the main things that matter is how many leads have you generated for your clients?
And yes, mentioning the number of leads generated in your monthly reports will help you to show value to your clients.
So, how to track leads metrics?
You need to create goals in your Google Analytics account, to track your lead count.
Check out this article on how to get the most out of Google Analytics for Lead Generation.
If you have already created the goal in Google Analytics, you can find the organic goal conversion under Acquisition > All Traffic > Channel.
2. Quality of Traffic –
Your SEO strategy will be pointless if it doesn’t bring quality traffic to your website. Traffic is the best way to understand your audience. But as we all know, organic traffic is not going to increase unless you are ranking on the 1st page.
When you do SEO for a website, the overall user experience of the website improves including desktop & mobile speed, UI, content, etc. All these improvements will also reflect in Analytics with better metrics.
Check out for these metrics in Analytics to actually measure the quality of your traffic:
Increase in New Users – Every business looks to gain unique visitors every day. New visitors might be visiting your website with a specific intent, landed through organic, ads, social, etc, Analyzing your new user’s data is essential when it comes to traffic quality. Acquiring new users signifies that a new set of users are landing on your website through different mediums because of organic & brand discovery
Increase in Organic Sessions – A session is the period of time a user is actively engaged with your website, app, etc. Increase in the number of organic sessions directly implies the increase in traffic to the website.
Acquisition > All Traffic > Channels > Organic Search
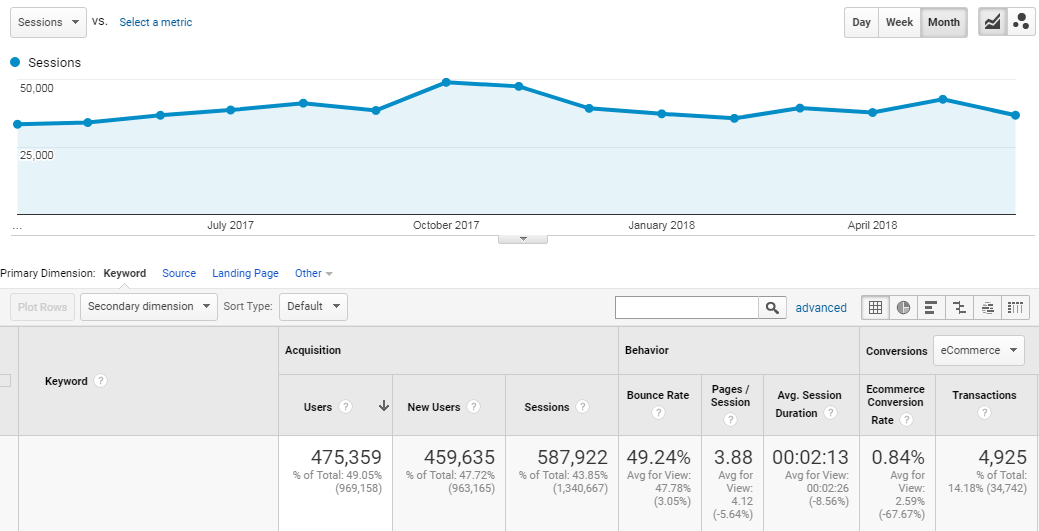
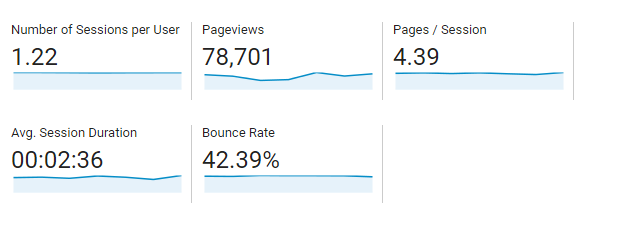
The other way to measure the quality of your traffic is through metrics like Pages / Sessions, Avg. Session Duration, Page Views, and Bounce Rate. It will help you to measure the quality of your traffic.
Increase in Pages / Session – Also known as (Average Page Depth) is the average number of pages viewed during a session. This metric is one of the best ways to know how much content a user is consuming after landing on your website. The average number of the page a user visits in a session implies how well the website is structured.
Increase in Avg. Session Duration – This is a very important metric to track. The average time spent on your website by a user signifies how much they like the website. Rank brain which is the third most important ranking factor in Google considers dwell time as one of the major rankings signals. The amount of time spent on your website after landing from Google gives them the signal about relevancy, content depth, and user satisfaction!
If you have a very low time spent, then start adding fresh and engaging content which will help you to hook the user for a long time.
Increase in Page Views – Average page views are the number of pages visited by a user in a single session. An increase in this metric implies that users are navigating and exploring to other pages of the website.
A decrease in Bounce Rate – The percentage of sessions in which there was no interaction with the page. In other words, if a user closes that page without clicking or interacting with anything then its a bounced visitor.
Pro Tip: Usually higher bounce rate % indicates that your website is not providing valuable content to the user. That is partially true because a recent article states that if you have a high bounce rate for content-rich websites then it is nothing worry unless your time spent is excellent. To put it in simple context, If your article has all the information and it fulfills the user’s intent then the user is not likely to click on any other page. But this metric should only be considered valid if you have excellent time spent.
These metrics will help you understand the quality of your website traffic.
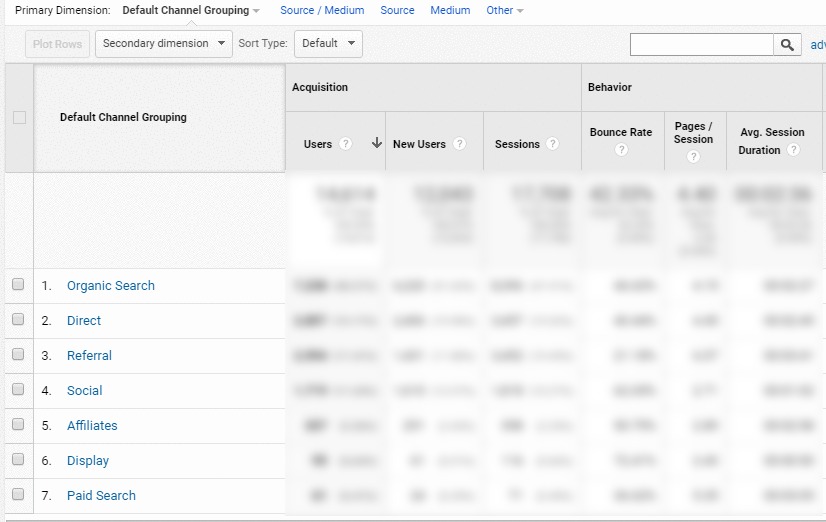
And yes, monitor your traffic channel source. In that way, you get a fair bit of idea which source is giving you good traffic.
So under Acquisition > All Traffic > Channel, you will get different traffic channel grouping along with Volume and Quality.
3. Improvement in Rankings:
Who doesn’t want to rank at Google’s first page? Website developers and SEO team spend most of the time making sure each page are well optimized and will leave no stone unturned.
For people who just started their small businesses with little or no existing web presence, reaching the top of the search rankings will not happen overnight. That’s the reality! You can’t do anything about it.
How to exactly check your average rankings improvements?
1)To start with this you need to find keywords, search volumes, initial rankings and current rankings (or rankings on monthly basis)
2) Create an excel sheet and plot all the keywords data in that. Make sure to plot all the rankings on a month on month basis.
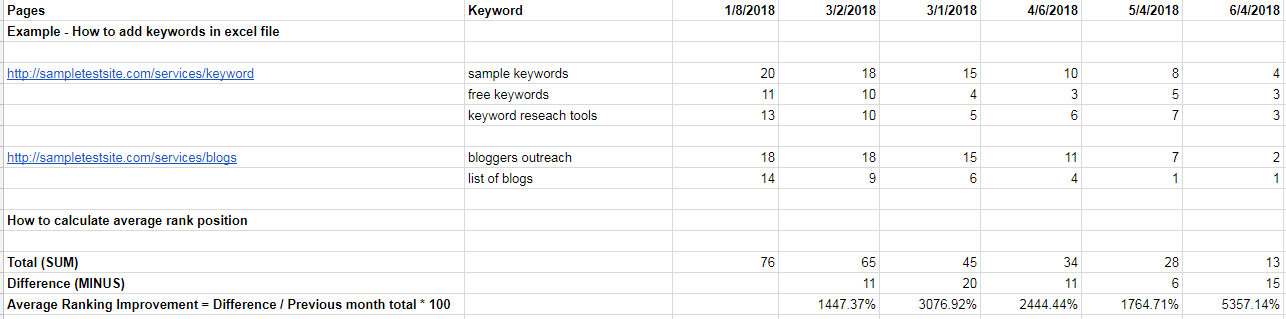
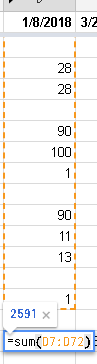
3) Do the total sum of the initial ranking positions using the formula =sum(column x : column y). Drag this formula for all the month’s rankings you have:
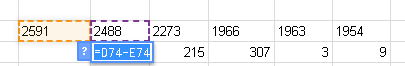
4) After you have obtained the sum of initial rankings on monthly basis, calculate the difference by subtracting the current month’s total with previous month’s total using this formula:
=column x – column y.
Similarly drag this formula for each month’s keyword positions you have.
5) After you got the difference of every month, calculate the average ranking improvement using this formula:
= Difference / Previous month total sum * 100
So the formula for calculating the average ranking position is:
Current month’s difference divided by previous months total multiplied by 100.
You can track keyword based rankings manually each month and calculate its average position based on the estimated results you acquired or else you can use paid tools which can give you a faster result.
It will help you get a percentage idea of how much increase or decrease of keyword rankings you had over the few months.
Note:- Remember, when you launch the website, the keyword rankings usually start at a position value of above 100 i.e. 10th page or more in google search engine.
4. Increase in New Visitors
Google Analytics is purely data-rich, and if you understand how to harness the power of this rich data-source tool, it will give you every valuable information you need.
For every business, the primary goal is about getting more and more new visitors to their website who will probably end up being your customer.
Google Analytics, elevated this factor and started giving fantastic insight about visitor information, the behaviour pattern, demographics (age, gender, location) and many more.
New visitor navigates your site for the first time on a specific device whereas returning visitors have already visited your site before.
Pro Tip: We all know this basic understanding but lot of user gets confused with this. What if you visit a website from your desktop at work or home, and then revisit the same website again from your mobile device? Will it be counted as one user or two new users?
Previously google analytics would record it as two new users but now they have made significant changes by improving the way it tracks data. So now if you’re logged onto your Google account from all the devices(work, home, mobile) and repeats the same process above, you would be recorded as a New Visitor on your desktop, and a returning Visitor on your mobile device.
To check new visitors and returning visitors report in Google Analytics, click on Audience > Behavior > New vs Returning.
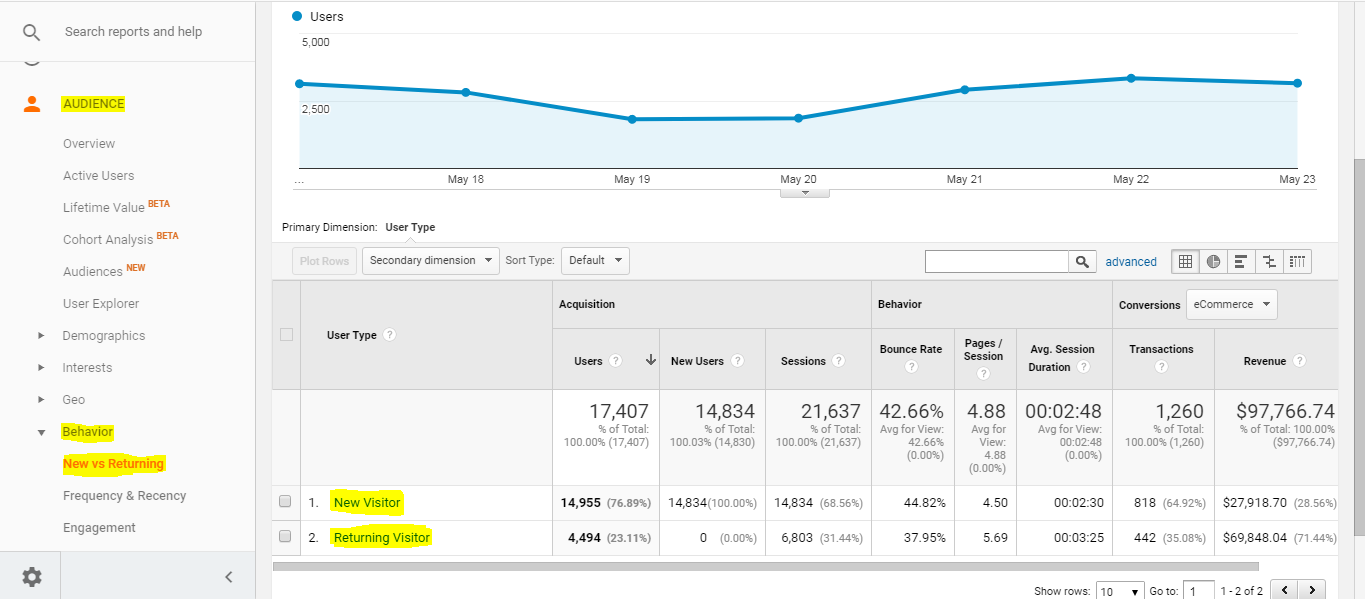
Google Analytics report on New Visitors will help you measure your success rate as new visitors usually lands through search engine(ads or organic). If you know one of your keyword climbed to the 1st page you will see an increase in the new users data because of the organic discovery.
5. Webmaster Impressions –
Wait, what? How can impression be considered in measuring SEO success?
Most even we tend to neglect because Clicks, Click Through Rate (CTR), Position are given more priority. But make no mistake, an impression is critically important because it gives you a clear indication of how your website is performing in search engine result pages when a user is searching.
It gives an estimated idea how many impression you are getting in comparison with Clicks, CTR, Position.
What are impressions?
When a user searches something in the search engine all the results that appears for it are counted as impressions.
So for example, if a user searches for a keyword: “Content Marketing” the 10 organic results that will appear on the first page are all counted as impressions. Usually user clicks on 1-2 results, so those websites(which got clicked) will get the count of impressions + clicks and others will get the impression count.
It’s one of the ways to analyze how web users interact with your search engine listings. You can assess your listing per impression at different search result page position.
So based on impression data, you can get a fair estimate idea how your much your website will be growing organically in the coming days. In other words, if you are ranking on the first page on 8th position so you will get a lot of impressions but less clicks which means once your website starts to climb positions you will have increased organic traffic. Similarly if you see a sharp decline in your impressions it means something is terribly wrong with the website. It could be a penalty, core algorithm update, a server error, redirects errors, or simply the website could be down!
Read this case study on how we recovered from September 2019 Core Algorithm Update
How To Check?
In Google Search Console select the preferred property and, check out:
Dashboard > Search Traffic > Search Analytics
.
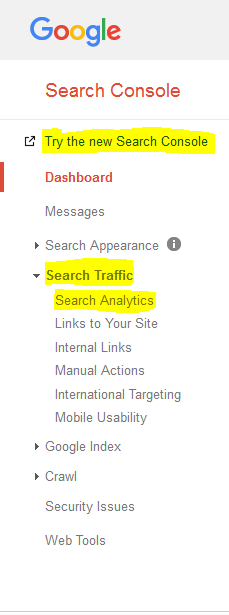
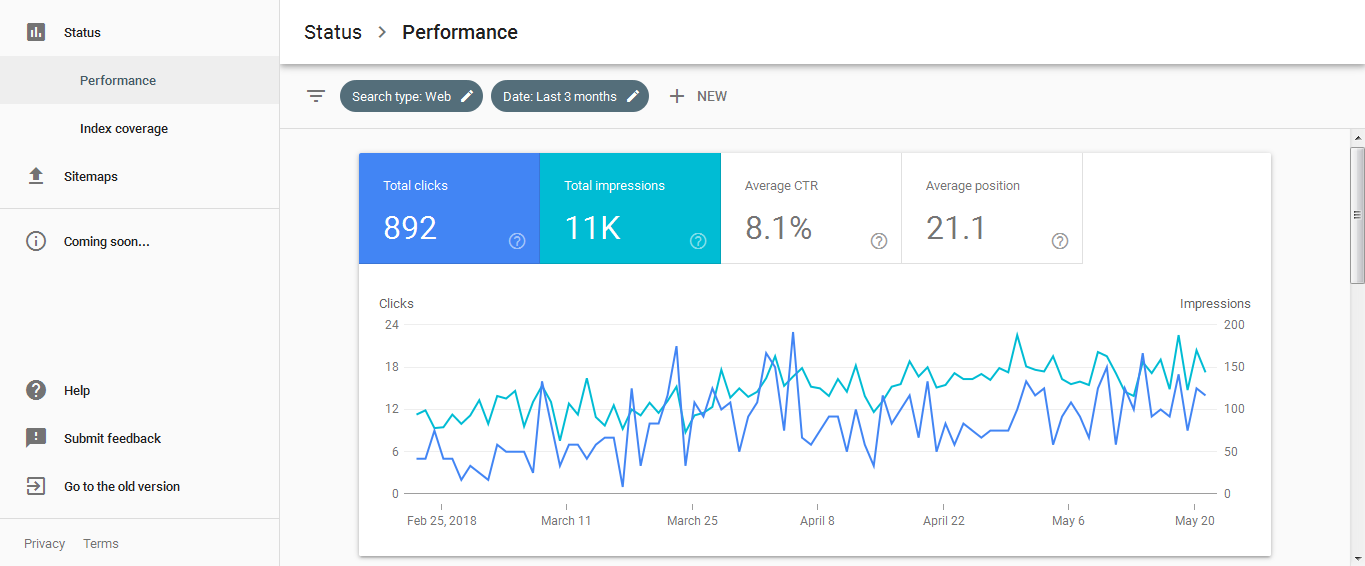
You can also view this report in new search console under:
Status > Performance
It will give you an overview graph report of total clicks, total impressions, average CTR and average position
.
Google has released a detailed report document on Impressions, Positions and Clicks in the Search Analytics Report of Google Search Console.
6. Micro & Macro conversions –
Google Analytics is a powerful tool that helps you understand how your website is performing and gives you all the data insight you need. Most often, we care about the primary conversion goals (which in other words is termed as macro conversion) because that’s the results which matter to everyone.
But are you measuring those little steps on your website which leads to macro conversions? Those small actions that users take on your site is called as micro conversions. If you are not measuring, then you’re probably not using the full extent of behavioural data.
Micro conversions help to measure how visitors are engaging with your website before making any purchase. No visitor will directly purchase something; they tend to browse first to see what your site has to offer.
There is a slight difference however between goal conversion and micro conversion?
Following things can be measured in goal conversions:
Subscribed to newsletters, updates & alerts
Contact us
Landing pages
View products
Then, What can be measured in micro conversions?
Followed a topic or shared content on social media
Add to cart / Wishlist
Viewing video
Download files such as PDF, brochure, ebook, white paper etc.
If visitors are viewing specific articles before sharing them on social media, if they sign up for the monthly newsletter or downloading specific files, all this helps to increase awareness of your brand plus they’re showing a keen interest which may lead directly to a sale soon.
It also helps us to see if our website is compelling enough to engage the audience.
How to set up goal conversion?
Using google analytics, you can set ‘goal’ to measure your goal conversions.
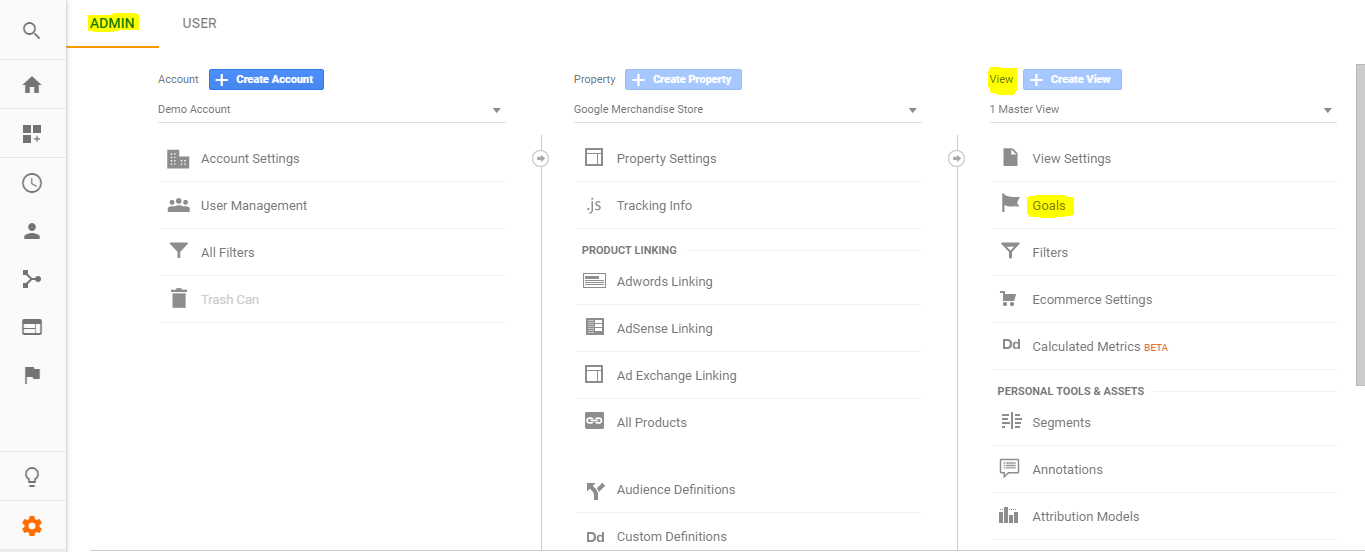
Click on Admin Tab > Under View property > Click on Goals.
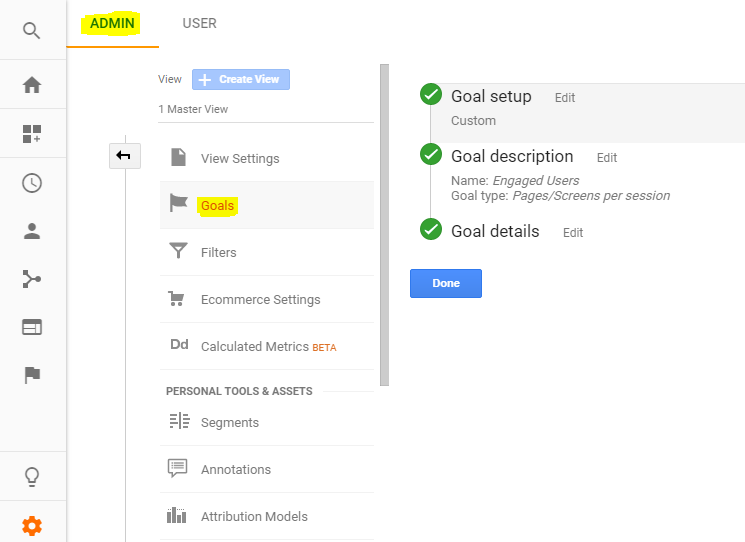
You can configure goal setup, description and details under this section to measure your goal conversions.
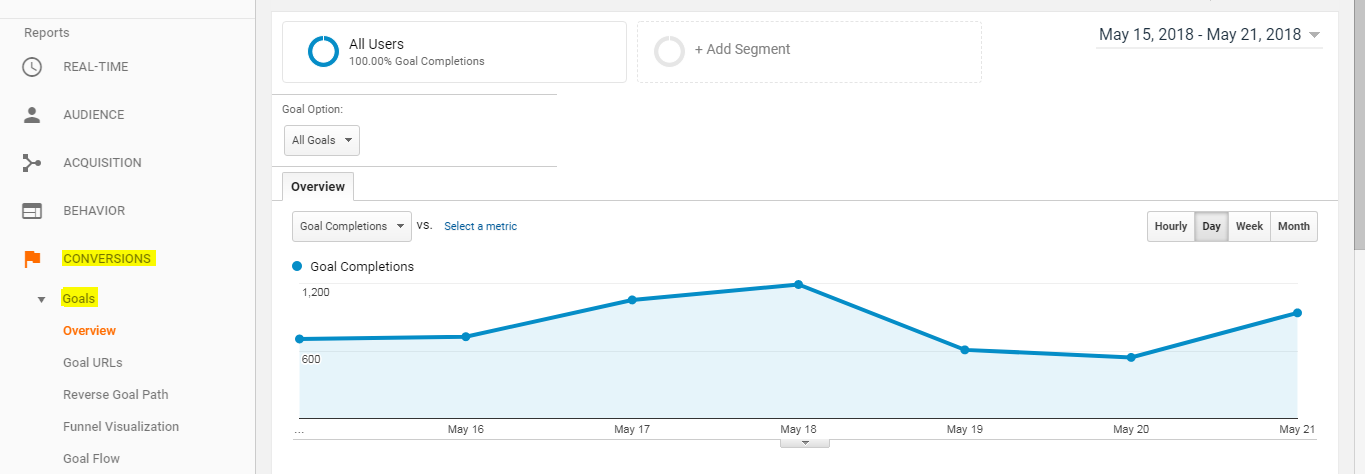
To see the report, Click on conversion > Goals, and it will tell you how many goal conversions occurred on your website.
How to set up micro conversion?
This one is slightly different from goal conversion, as you need to put event tracking code in your website code.
You might be wondering hold on, what the hell is this event tracking code now? Is google analytics tracking code not enough?
So a quick description of what event tracking is all about. Events are generally user interactions with the website content, and that can be tracked independently using a javascript code. This helps you understand how many events are triggered every time when a user is viewing your website.
Event tracking is slightly different from the Goal Conversion setup. Google has published a small guide on how to implement event tracking code to your website. Once your web developers execute the code on the website. You can track any events you have set.
Micro-conversion will help you measure your SEO success, as you get a more in-depth analysis of how many users are viewing your specific content. This will help you further to serve your audience with the right material.
For detailed information check out on how to measure macro and micro-conversion, written by Avinash Kaushik, where he recommends, “Focus on measuring your macro (overall) conversions, but for optimal awesomeness identify and measure your micro conversions as well.”
7. Links to your site (Referral) –
To measure your SEO success, backlinks are by far one of the most critical factors, as they help website rank within the search engines. Usually links act as a vote of trust mainly because they pass “link equity” from one website to another which helps the other website to rank better. It’s also referred to as “inbound links”.
Sometimes, high-quality sites with a lot of traffic can link to your site, but even if you get a nofollow-link which might not help you in ranking, it will boost your traffic source. Hence high-quality backlinks with nofollow-link attribute also pays a dividend, so it’s worth the effort.
Just keep producing high-quality content, i.e. via content text, video, infographics, blogs, case studies, articles and promote your content at the same time. Let your backlinks develop naturally & remember, Google loves quality and relevancy.
How to track referral traffic?
Under Google Analytics > Click on Acquisition > Referrals > Under Secondary Dimension > Type Referral Path. It will give you an overview idea about how much traffic you are getting from where you have build backlinks
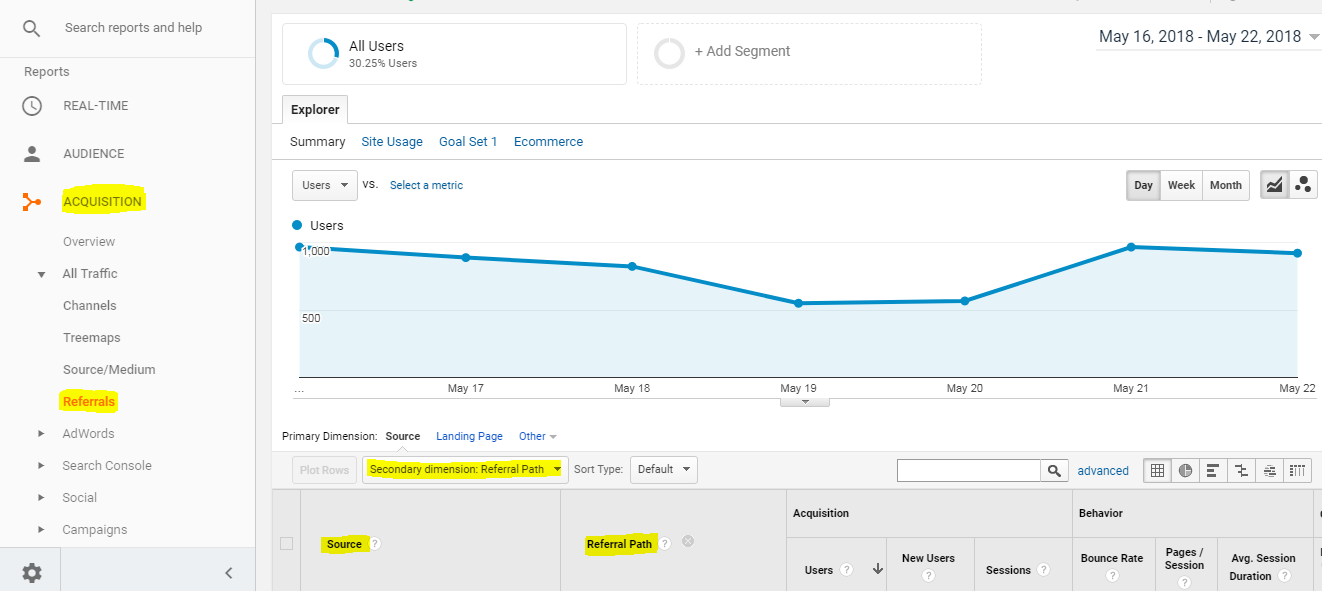
.
8. Page Load time –
Page load time is a major factor in search rankings but often overlooked mainly because many SEO’s tend to focus their attention primarily on content and link. But from a user perspective, if the website loads up slowly (i.e. if it is taking more than 3 seconds to load), you are potentially losing valuable customers.
That’s one of the main reasons why optimizing page load time is very crucial. A faster-optimized website will give you a better conversion rate & will boost your sales revenue which is ultimately the business goal for each firm. Though the company will benefit from sales revenue, the real impact it will create is customer experience.
The cycle is simple: A happy visitor > Converts into a happy customer > Will share the experience with others > They will come back as returning visitors. This creates a big positive impact on your sales & marketing funnel.
To give a contrasting example – Read this case study on how pagespeed can impact sales for amazon
In one of the line, it states that:
“Amazon’s calculated that a page load slowdown of just one second could cost it $1.6 billion in sales each year. ”
So how to identify slow loading pages and its direct impact on conversion rates?
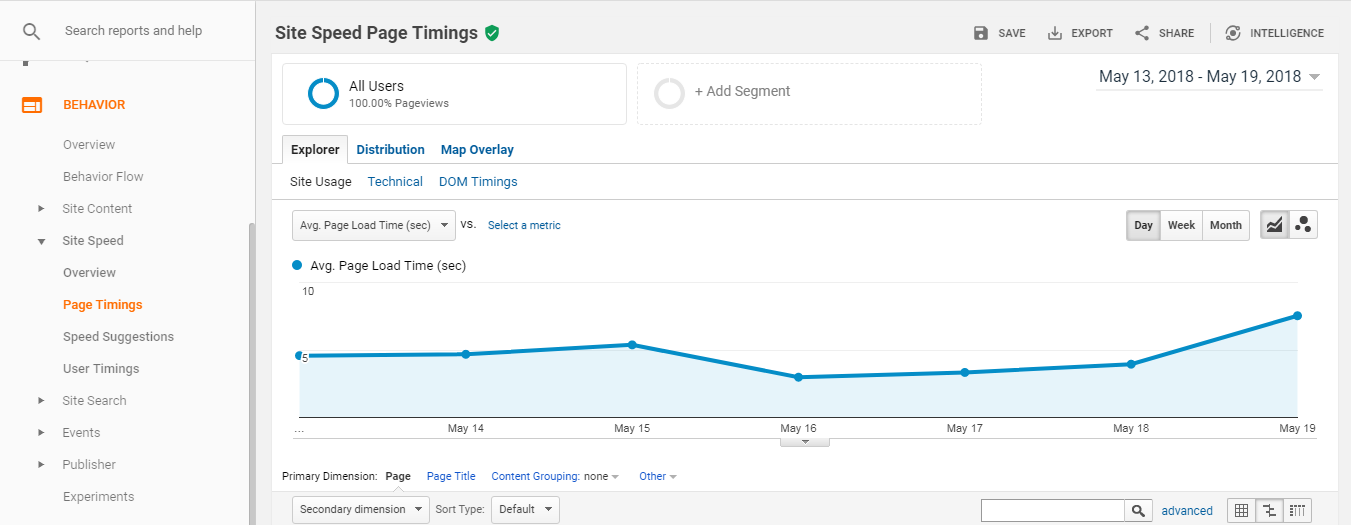
In Google Analytics, to measure page load times navigate to Behavior > Site Speed > Page Timings. After filtering down and adding a secondary dimension, you can analyze which pages are having load issues and then generate the report.
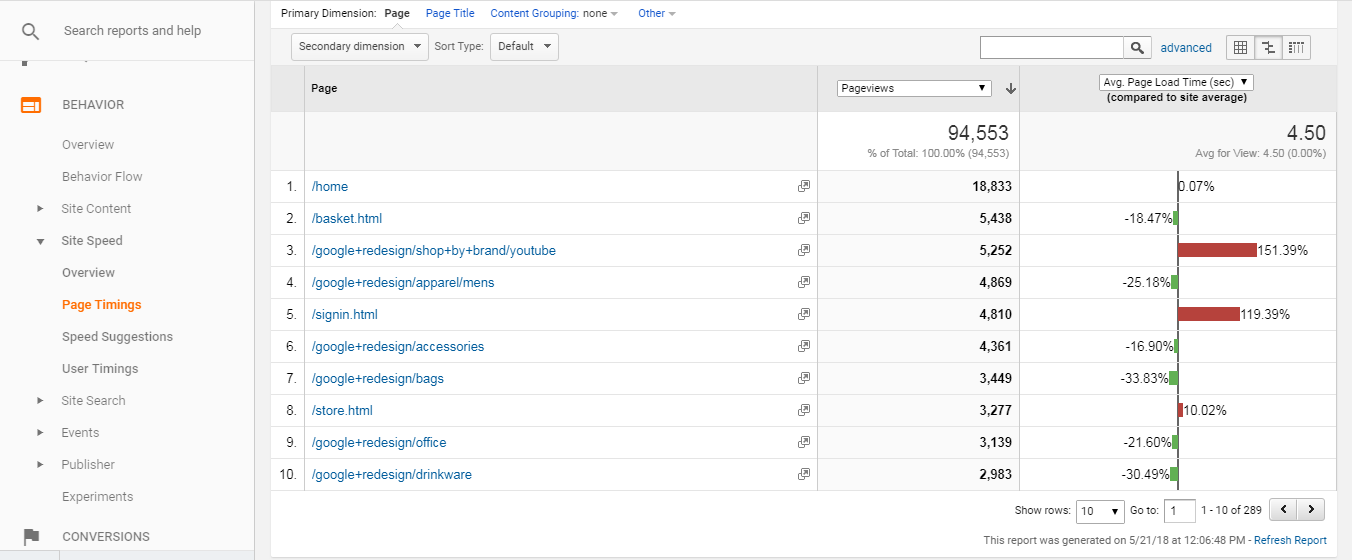
Based on the report, developers will make all the necessary changes to optimize the website. Once page load times have been optimized, generate a new report and compare it to the old report to see if any difference in search traffic and conversion.
Are you losing out on conversions and sales due to a slow loading website? Hubspot posted a video on why website speed matters.
To summarise the importance of site speed, Google has officially said they are going to consider site speed as a ranking factor starting July 2018
Summary –
After going through all the significant factors in measuring your SEO success, there is a perfect quote which summaries everything. “If you can not measure it, you can not improve it.”
Therefore remember, measuring your results is crucial for any SEO campaign success.
Let us know in the comments below, if we missed any important metric to measure SEO success?