
Yandex Metrica – An Alternative to Google Analytics
Google Analytics, Yandex Metrica, Woopra, Kissmetrics, Crazy Egg, etc. With so many analytical tools available in the market, there is a lot of chaos amongst the webmasters in coming up with the most desirable tool.
The search world is Google-centric and there is no doubt that Google Analytics drives you to a huge data, though every tool is great at some of its features! Metrica proves it in a better way.
Though Google has clearly suppressed other analytical tools in the terms of popularity & market share, there are a few cons in it that you may not have heard of. And with this, you may be missing out huge & super-useful data insights about your website performance & user behaviour metrics. Remember, every tool has its own pros & cons & we are not saying to part your ways from Google’s tool. We will discuss the cons of Google Analytics & help you to overcome to help your business grow.
By opening your options to alternate tools like Metrica, you are opening a door to new data insights that Google’s tool is unable to provide you.
Get a live demo of Metrica & Google Analytics.
Well, let’s check it out how Yandex Metrica plays a great alternative to Google Analytics.
Let’s start with the basics!
So what exactly is a web analytics tool?
In a lucid language, a web analytics tool is a digital marketing tool used for measuring, collecting, analysing and reporting of important metrics of a particular web page or a website as a whole.
So What’s this Yandex Metrica?
Yandex Metrica is the second largest web analytics platform, provided by the popular Russian search engine called Yandex.
It was launched in the year 2008, three years after Google released its Analytics tool.
And guess what? It’s free! It’s not even limited just to Russian sites, also it doesn’t have any restriction in the Chinese market as Google analytics does. It can be used by any website from any part of the world. This tool lets you go through the important metrics and get insights of a particular website and come up with actionable plan to tackle the factors hindering a site’s performance.
The best part about Yandex Metrica is that it does not limit data. It gives you precise data no matter how many sessions or page views you have, unlike Google Analytics it doesn’t sample data.

It will surely leave you flabbergasted after you get to know what’s unique with Metrica. What if I told you that you can actually check what actions are being taken by your website users? Yes, that’s happening! Metrica does come along with some incredible features like Heatmaps & Session replays which walks you through the customer’s journey on your website.
And all these come to you for free! Isn’t it amazing? Still not convinced enough to use it? So just stick along and keep reading to get more on it.
Below is an overall comparison with some of the common & unique features in both the tools.
Yandex Metrica vs Google Analytics:
| Comparison Parameter | Yandex Metrica | Google Analytics |
|---|---|---|
| Popularity Rank | Metrica ranks at 4th position | Analytics ranks at 1st position |
| Market Share | 4% | 96% |
| User Session Recordings | Available | Not Available |
| Link & Click Heatmaps | Available | Not Available |
| Goals Tracking Limit | 200 | 20 |
| Traffic Limit | Unlimited | 10M hits/month for free properties |
| Page Speed | Speed is severely impacted | Comparatively less impact on page speed |
| Site Monitoring | Offers to monitor for availability issues if an outage or error occur | No monitoring available |
| Pageviews Metric | Refreshing a page within 15 seconds is not counted as a different pageview | Analytics will consider another pageview if the page is refreshed (no minimum time limit) |
| Bounce Rate Metric | A visitor is considered “bounced” only if they visit one page and spends less than 15 seconds before exiting | All the single page sessions in Universal Analytics are considered as bounced sessions. |
| Data Sampling | Metrica offers unsampled data – no data limits | Samples the reports at a threshold of 500k sessions in a date range.For accurate data you will need to upgrade to Analytics 360 |
| Number of sites per account | Unlimted | 50 |
| Tool Pricing | No charges | $150,000 dollars a year for premium version |
Since there is no complete guide on using Yandex Metrica, we researched & came up with this extensive guide to help you understand Metrica’s user engagement metrics & unique reports.
Getting started with Metrica
To create a Yandex Passport (yes, that’s what Yandex user account is called), you need to go through a registration process and get signed up before getting access to the tool. You can also opt to sign up via social accounts. The sign-up process is so simple that you don’t even need a visual representation of it.
After going through the whole sign up process, you need to add a counter.
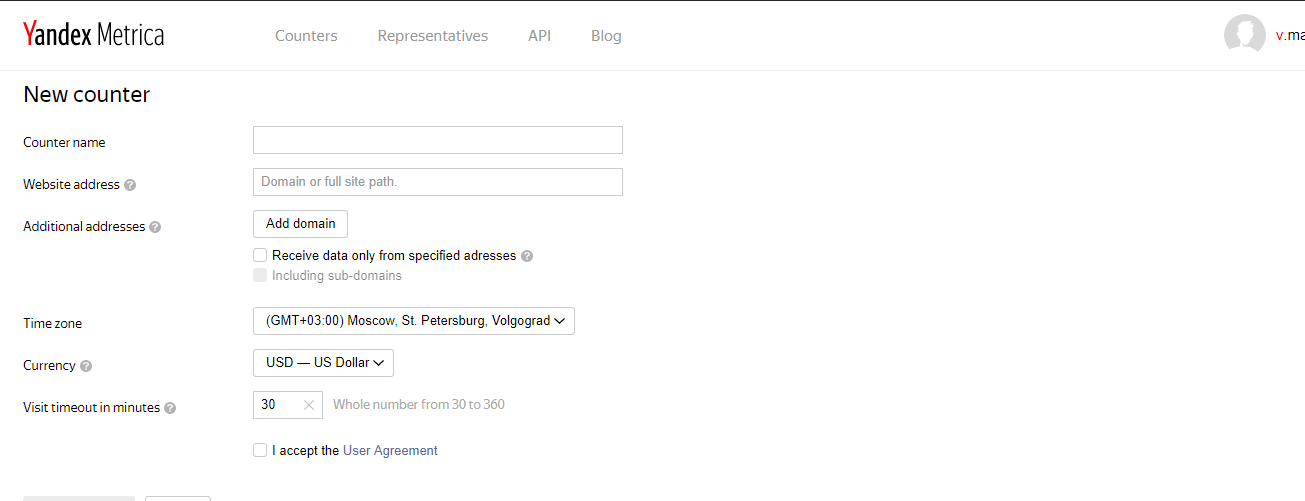
- It starts with the counter name, you can add your company name as the counter name
- Next, you have to add the website domain.
- You can also add an additional domain in the additional domains section. This step is not mandatory though.
- Then comes time zone & currency which needs to be added.
- Select I accept and move on to create counter and hit it.
Counter code
The counter code is the place where you can create the tracking code which needs to be placed on our site’s backend in the HTML code within the body. Before placing the tracking code into the body, you need to select the options which you need to track.
In our case, we have chosen the following options which can be seen in the image.
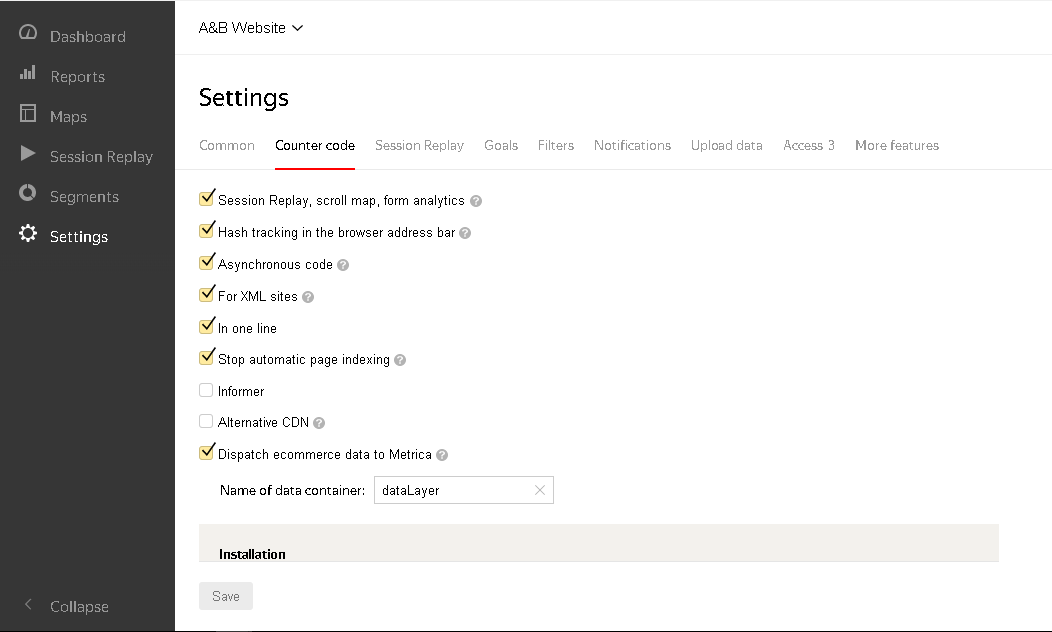
After selecting the necessary tracking options it will generate the HTML code which needs to be inserted on each and every page of your site. It does not take long for the data collection process, it starts immediately after the code is placed.
(Note: The counter code changes every time you select or unselect any of the options above. So you need to update the code on your site each and every time you come up with any changes in the above options.)
A sight at the dashboard: Quick view
The dashboard comes up with a sight friendly layout, easy to understand and gives you a quick summary of what’s up with your website.
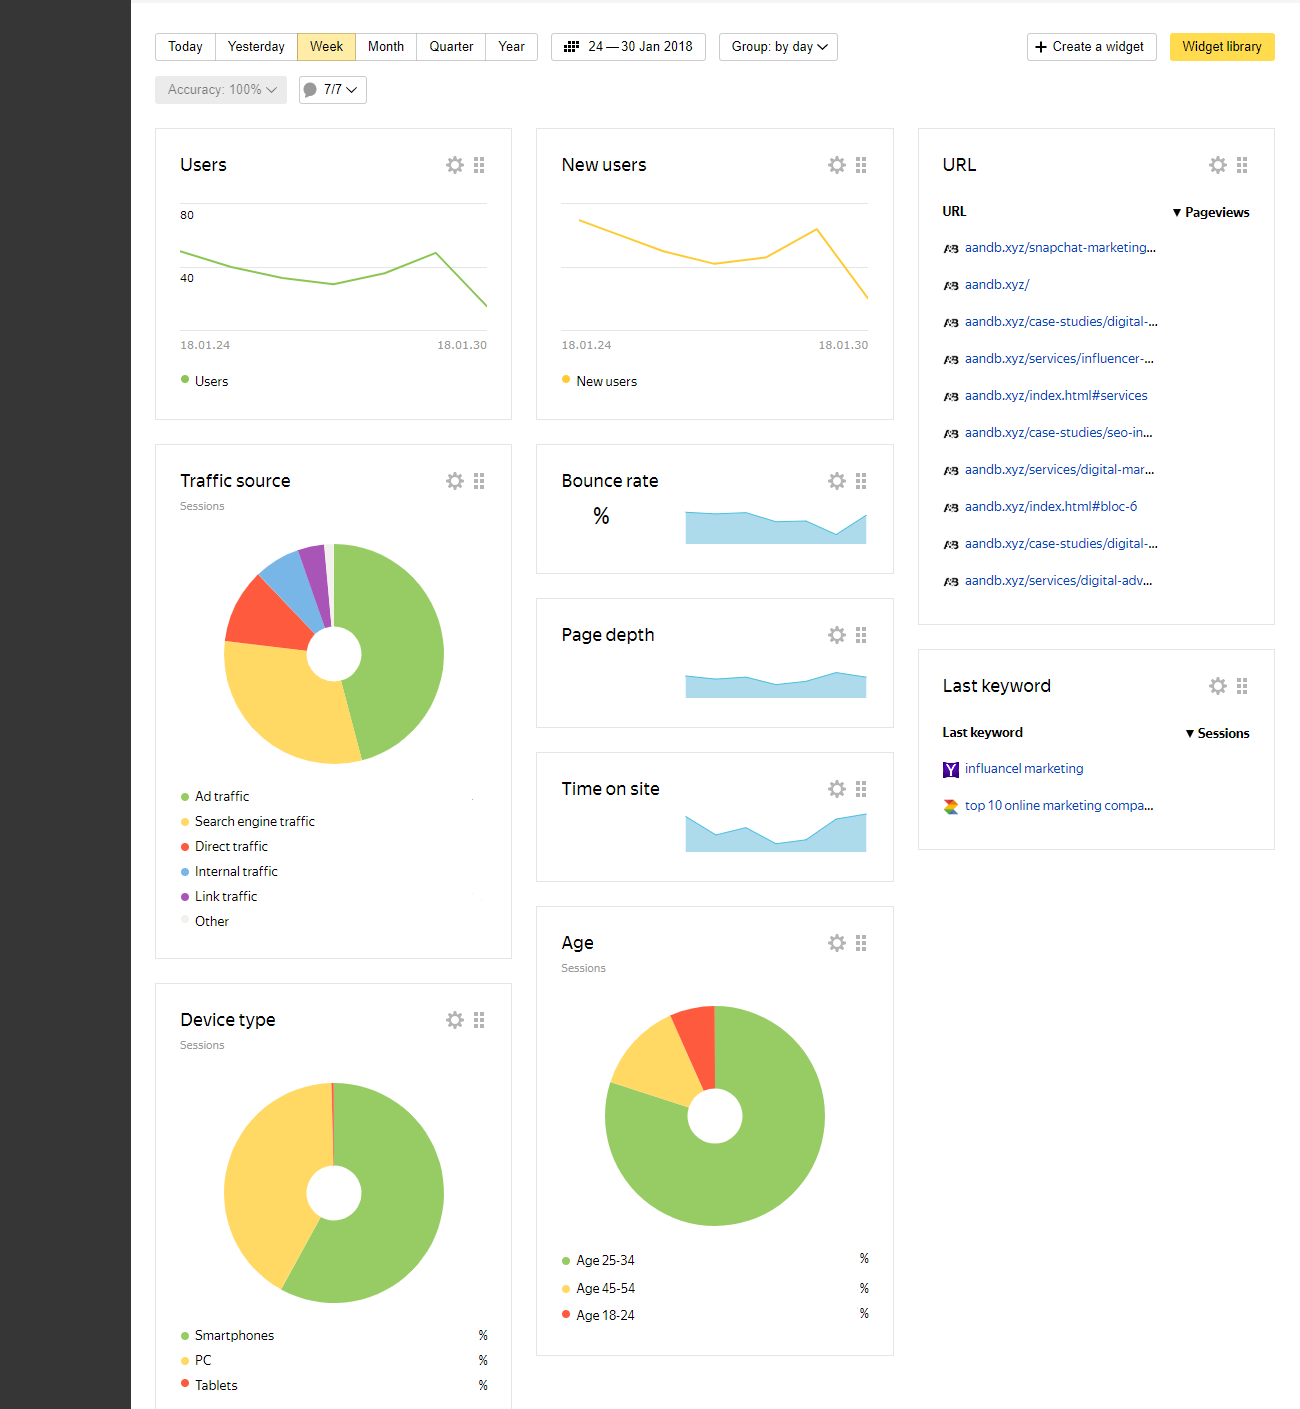
- It gives a view to the number of users who interacted with the site
- Also keeps a track on the number of new users
- You can check out which URLs are getting a good number of views.
- You can see where exactly your traffic is coming from (in the traffic source section)
- The device type section gives you view of what kind of devices have been used to arrive at your website
Reports
Reports make a crucial aspect of any analytical tool. Metrica lets you create standard and customised reports as well.
Here’s an introduction to each type of report.
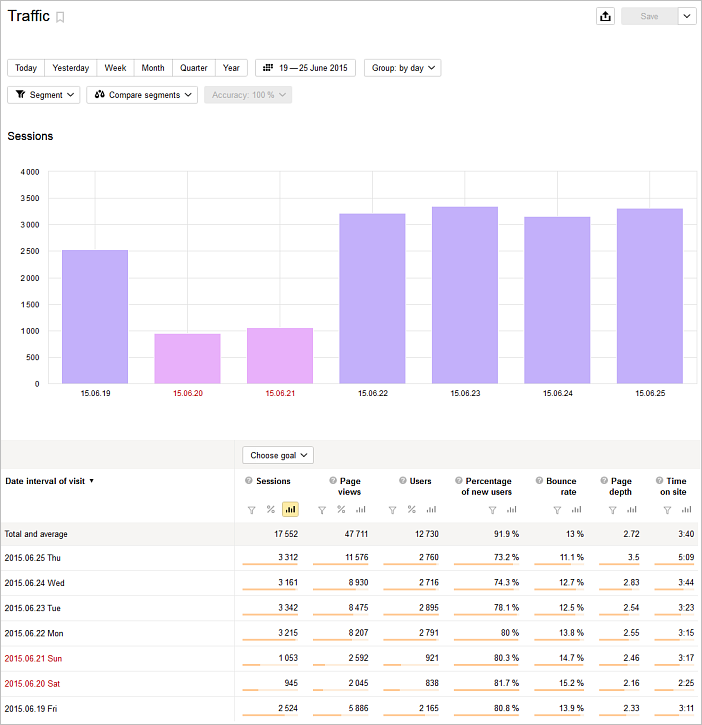
Traffic
You can create traffic reports which give you an overview of your visitors. Basically, you can view the number of people who visited your site, the date and pages did they visit, their dwell time, bounce rate and so on.
Conversion
Conversion reports aid in tracking the goals set by the webmaster. A goal can be any action which a webmaster wants the visitors to take. For example, subscribing for newsletters or making a purchase can be considered as a goal.
Sources
The source reports let you see the sources from which your traffic is coming. Subcategories like sites, search engines, social networks etc which drive traffic are specified in the Source section. You can explore all the options given and check where your traffic is arriving.
Users
Here you can check where your users are coming from (geographical location), their interests, their demographic info, their activity on the website and so on.
Content
The content reports portray the subcategories such as popular pages on your website, entry pages (landing pages), exit pages, titles etc, and shows the data on their sessions and traffic.
Technology
Basically, you can create all the tech reports (reports on the type of browsers, display resolutions, operating systems, devices, etc.) in this section.
Monitoring
Monitoring reports include the following options like the load on website, traffic by a minute, page load time, etc. There is a need for more than 100 page views (per week) for this feature to work though.
E-commerce
E-commerce reporting lets you analyse data related to your products. You can track your number of purchases, the number of users who bought your product and so on. You can check which of your product is performing best.
Navigating through maps
So what’s exactly a link map anyway?
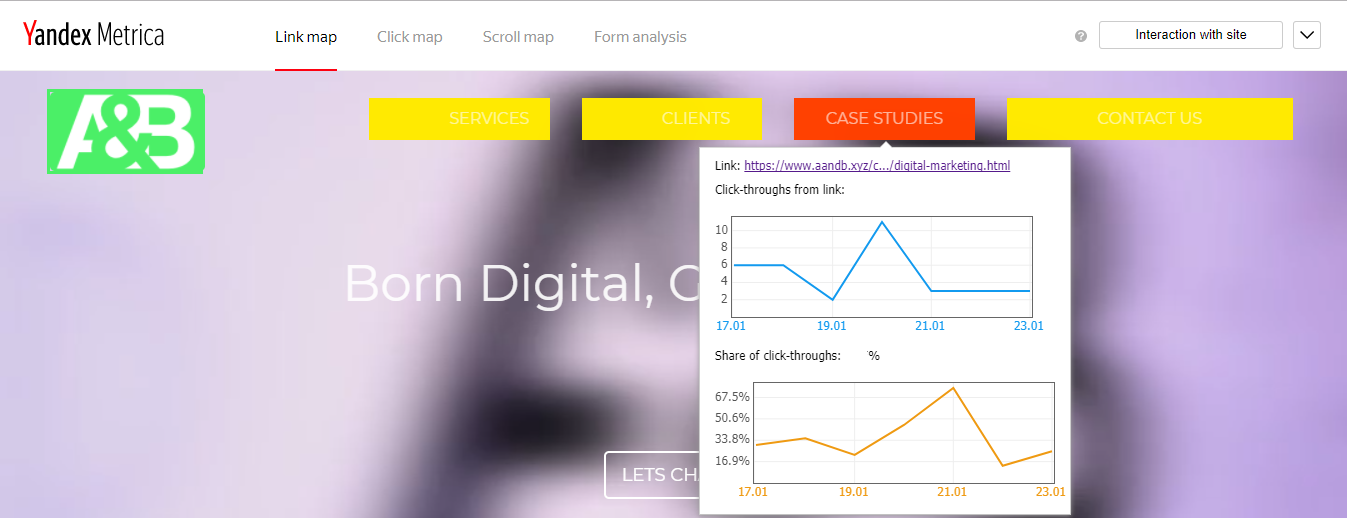
Link Map is a feature which goes into a deep analysis of link clicks, it portrays how popular a link is by highlighting it with specific colours. The cool coloured link gives an idea of low popularity whereas a dark or warm coloured link says its highly popular. By clicking on the link you check for the number for click-throughs and the percent of shares that particular link has got.
Click maps (Heat Maps): Turning on the heat
As a digital marketer, you must have surely come across the concept called heat maps! If not then let’s have a brief.
Heat maps are the visual representation of data in the form of specific colours. These specific colours are given on the basis of the visitor’s actions (clicks) on the page. The more clicks on the portion, the more is the heat.
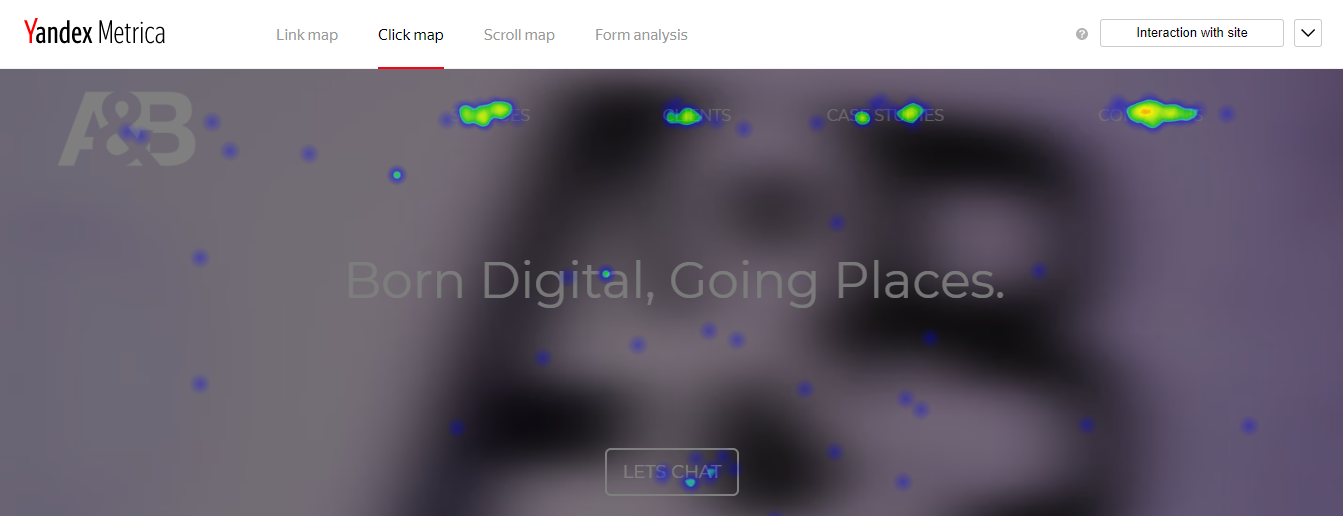
It is a kind of rescue tool! It comes handy when you want to know which part of the content needs a change, is the call to action worth converting? You can even check whether the call to action you have placed in between the page works or not and if not then you can place it somewhere on the top where people may potentially click.
Scroll Maps: How long they go?
So you came across a piece of content which you started reading, kept you scrolling for a while and suddenly left?
I’ll tell you what exactly happened, you lost interest!
What if this is the situation with your own website? Sounds like a nightmare!
Well, have no fear! Metrica has a solution for this! Get Scroll maps to the work.
This feature lets you know how long people keep scrolling on your landing page and how much of the content do they keep reading. Such data help you in placing your important call to actions. You can even try adding bucket brigades (at the point where you find people stop scrolling further) within your content to make it more compelling which will make your audience to make it till the end.
Form analysis (for a hassle-free user experience)
There may be times when you have been shopping, and you came across your favourite product, selected it for buying and headed towards the checkout and there arrives the issue; the form is too lengthy, or there is no auto-complete feature, also the layout of the checkout form is confusing. Being irritated, you decided to leave the website abandoning the product within the cart.
And if the same is happening to your site, then guess what? You’re at a great loss.
Fortunately, you can get this fixed. Here’s the deal!
Form analysis lets you examine the various forms like contact form, product form, and the search bar from your website. It gives you the data on how many users have seen the form, out of which the number of users who have filled the form and how many drops have happened in a particular form field.
For more info on form analysis, you can check out Yandex support.
Playing along with Session Replay
Ever thought of getting a peek at visitors actions? If your answer is yes, you’ve got the right tool then. Yandex Metrica does come with such a feature, known as session replay (previously which was called Webvisor).
The session replay gives you a bird’s eye view of the visitor’s behaviour by recording the important actions on the website. You can watch it anytime after it’s being recorded. Be it click, scroll or other movements on site, you can check out the interactions which can ultimately help you make better decisions about what’s working, what’s not, and also where to focus on your site.
Here’s a sample of Session replay.
Segments
Basically, segments refer to personalised reports. You can get any segmented report you have created within this section.
You need to go to any of the reports (from which you want to create a new segment) click the segment option and choose from the predefined segments ( or recently used, if any).
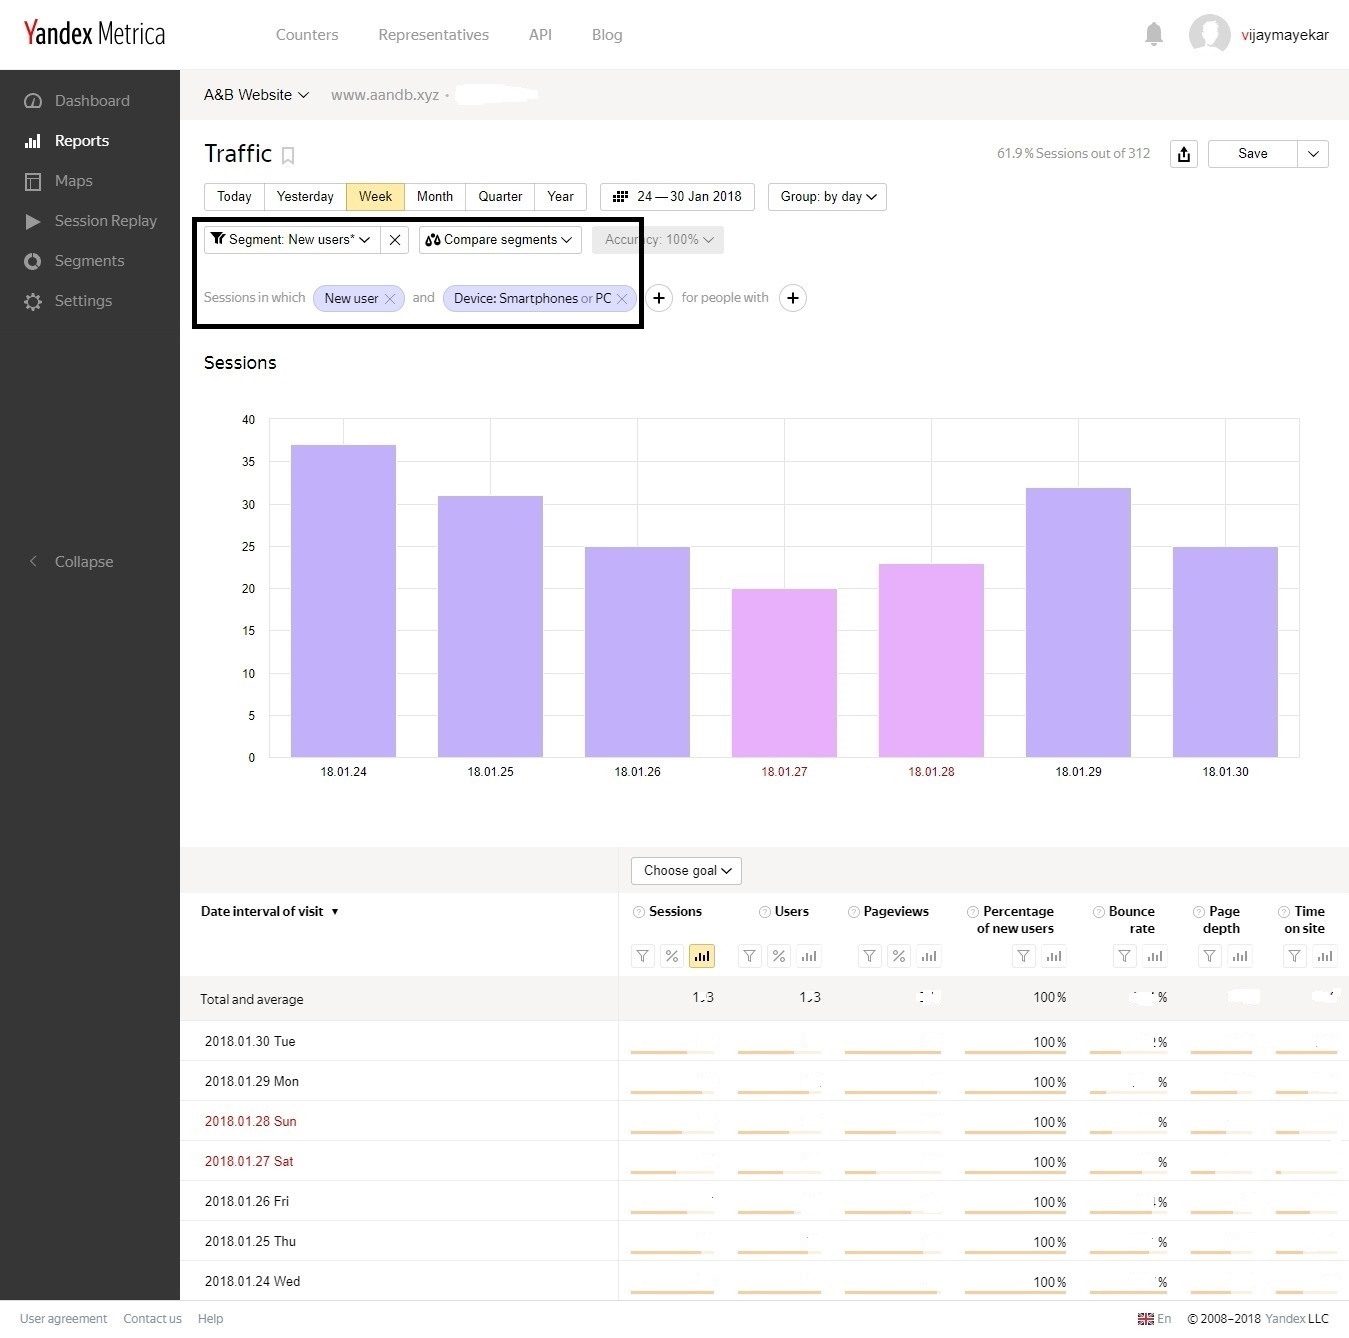
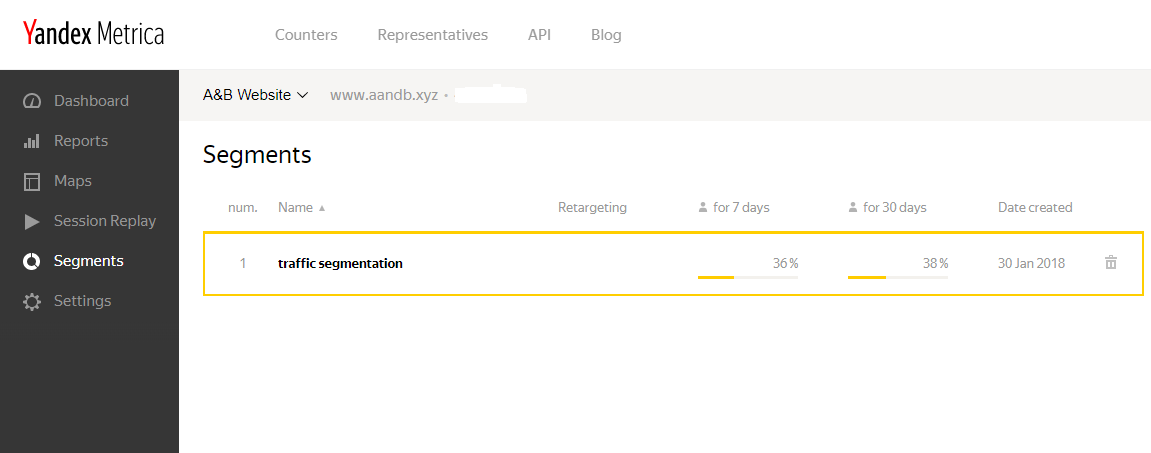
Using segments you can create your own customised reports for just viewing data which you have to track daily. For example, You started a new ad campaign for the holiday season and want to track it daily, you can create a custom segment for it, you will not have to dive deep into source/medium reports section daily
Settings
Common
We can add a new counter here, as we have already discussed on this.
Counter code & session replay are already being discussed. So moving on to the next option.
Goals
You can add a goal within this section. You can add around 200 goals to a single website.
Filters
This option lets you add filter out specific data. It is applied to source data in a specified order, coming up with the records which match certain conditions.
Notifications
Under notifications, you can opt-in or out for letting Metrica send you notifications informing when problems appear. You can get these notifications via your registered mail or contact number.
Upload data
You can add additional data from this section. Currently, there are two options under this category, namely ‘Upload user parameters’ and ‘Upload offline conversions’.
Access
You can allow Yandex users access to a particular counter by adding that user within the access option. You can choose to give the user a view option (which is limited to usage) or edit option which gives him full access to all the features.
More features
Offline locations, Yandex.Direct, “Calls” group of reports, Session Replay 2.0, Cross-device, etc. These are the additional features provided by Yandex Metrica. Some of these are under Beta version.
Some of the Cons Google Analytics has
Well, as I’ve already said, every tool is great at some of its features, and I am gonna stick to my words.
Some of the features which are not in Google Analytics are:
Heatmaps & Session Replay
It doesn’t have features like heat maps and session replay (already covered in the features section) which lets you analyse the website in depth and take actions accordingly.
Bounce Rate
There is a difference in the way Google analytics counts a bounce rate than that of Metrica. Google analytics counts a visit as a bounce when a user visits a particular page and does not have any activity on it.
Meanwhile, Yandex Metrica counts a visit as a bounce when the user leaves a particular page within 15 seconds (also if the visitor converts within those 15 seconds, it is not counted as a bounce).
Data Retention
Recently Google Analytics has updated their policy according to GDPR on retaining the users and event data. Basically, Analytics can overwrite user and event data in minimum 14 months. You can tweak the settings so that it doesn’t expire automatically, the default selection is 26 months.
Sampling Data
Google Analytics provides users with a sample segment when there is a huge data to be processed. In case you want to peep into precise results, you will have to subscribe to its premium version, which costs around $1.50K (USD) for a year.
Conclusion
You see! Yandex Metrica is seriously good at its power packed analytical data. There is no reason to ignore this potential tool.
Let me make it clear that I am not against Google Analytics. It definitely is a good tool. What you can do is, use Metrica as well as GA to get the most of your website’s insights.
So make sure to add Metrica to your favourites. Now get there amazingly fast and explore all the features specified above to make the most out of your website.
Very useful blog-post on Yandex Metrica, provides a ton of information about its advantage. I want to ask you a question ” Why you are not using Yandex Metrica on this website?”
Thank you for reading our blog. One disadvantage of Metrica that we have mentioned in our blog is that it severely impacts the page speed. If you run Page Speed Insights before & after adding Metrica, you will see that the main thread blocking time is increased by 950-1000 ms. Why are we not using it? Because recently, Microsoft has launched its analytics tool named Clarity & we are testing it on our website. The tool offers unlimited heatmaps & session recordings for free without impacting the page speed.
Great answer, I was also wondering about the page speed. Which makes Metrica not a very desired tool to use.
Thanks, Mariana. The impact on Page Speed pushes Metrica deep down “not-considering” stage